
Load testing overview
A load test sends your saved HTTP requests many times at once, for a planned length of time, and measures how the server holds up: throughput, latency percentiles, errors, status codes and where the time went. Thresholds such as “p95 under 300 ms” turn the result into a pass or a fail, so the same test can gate a CI pipeline.
A load test is a file in your workspace (loadtests/<name>.yaml, see Workspace format). You run it in the app, or in a terminal and CI with zorvik load. Results are kept on your computer, not in the workspace (see Results and reports).
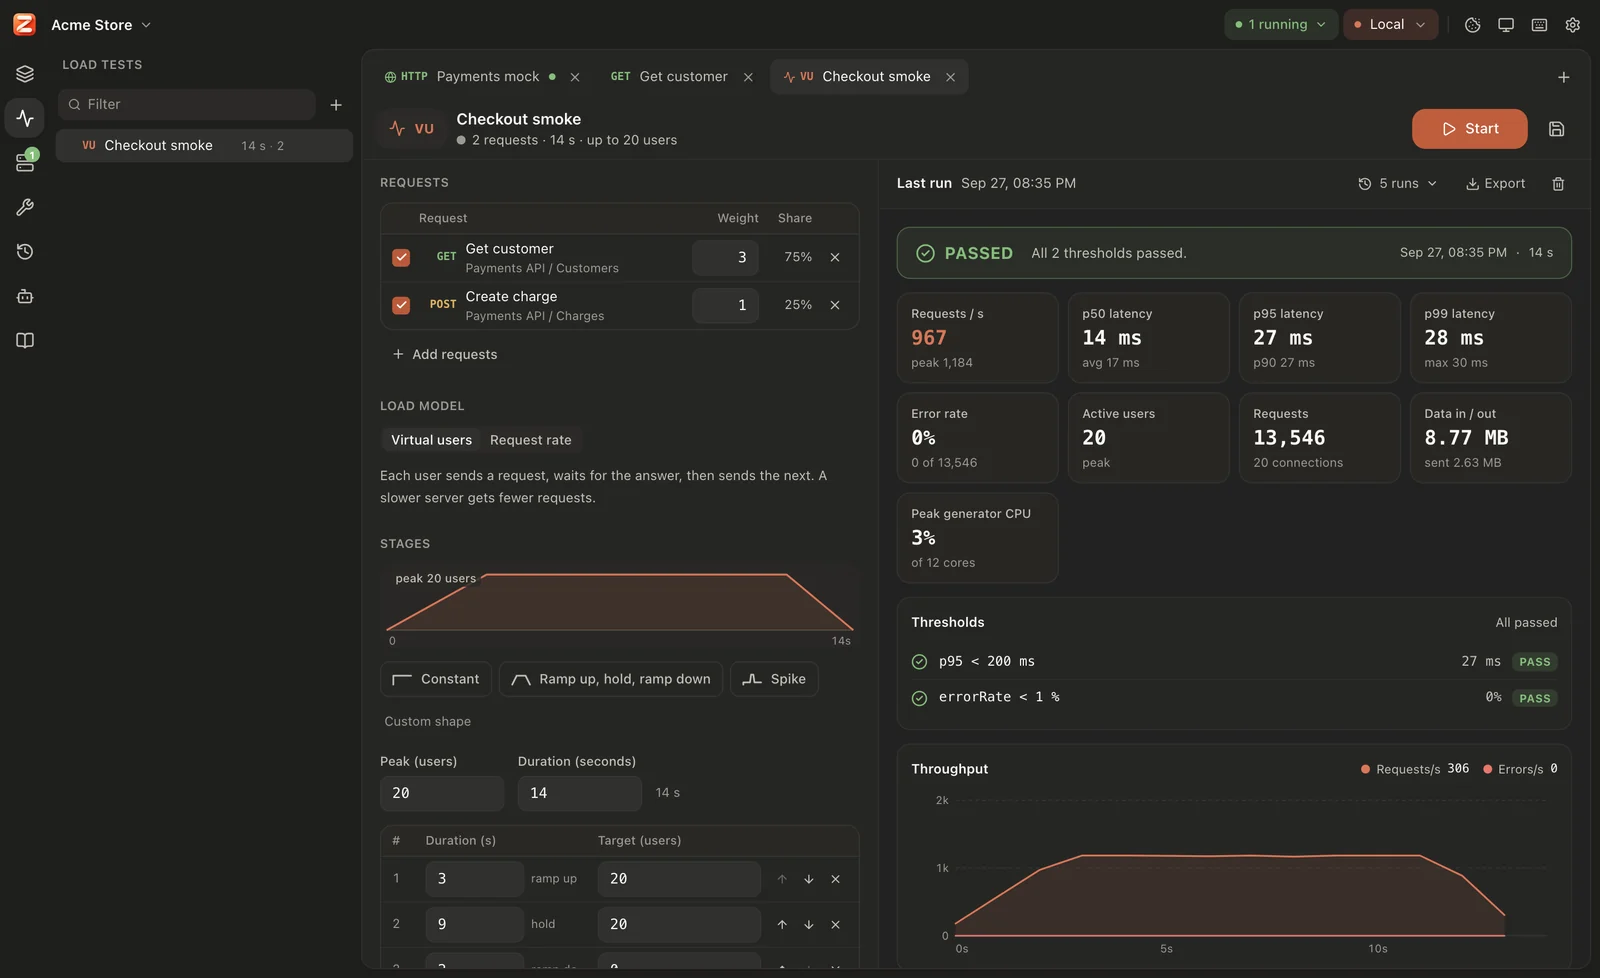
Create a load test
Section titled “Create a load test”Open Load tests in the left rail, then:
| Where | Action | What you get |
|---|---|---|
| Load tests sidebar, + menu | New load test | An empty test with the name you type |
| Load tests sidebar, + menu | Load test the collection… | Every HTTP request of the collection, weight 1 each |
| Collection sidebar, + menu (or right-click an empty spot) | Load test the collection… | Same as above |
| Collection sidebar, right-click a folder | Load test this folder… | Every HTTP request under that folder (recursively), weight 1 each, named “folder load test” |
| Collection sidebar, right-click a request | Load test… | That request alone, named “request load test” |
A new test starts with the same plan: virtual users, 10 s ramp to 10 users, 40 s hold, 10 s ramp down to 0 (60 s in total), and two thresholds, p95 < 500 ms and errorRate < 1 %. Change anything before you press Start.
Only HTTP requests can be load tested (GraphQL requests are HTTP requests, so they count). WebSocket, Socket.IO, SSE, gRPC, TCP, UDP, DNS and MQTT requests are refused with “only HTTP requests can be load tested”, and so are GraphQL subscriptions (they are live sessions).
The load test tab
Section titled “The load test tab”The tab has a header, a settings side and a results side. Below 780 px wide the two sides become Settings and Results panes you switch between.
- Header: the model badge (
VUfor virtual users,RPSfor request rate), the name, a status line (what the test will do, why it can’t start, or “Running · 32 s of 1m”), Start / Stop (Ctrl/⌘ Enter) and Save (Ctrl/⌘ S). A thin progress bar shows the planned time while it runs. - Settings: Requests (targets, weights and captures), Data file, Load model, Stages, Options and Thresholds. See Models and stages and Thresholds.
- Results: the live run, or the latest finished run, with the run history, Compare, Export and delete.
Start runs the settings as they are on screen, even unsaved ones. Edits made while a test runs apply to the next run (“This test is running with the settings it started with”).
Only one load test runs at a time in the whole app. While it runs, the title bar shows a ”● Load test 42 s” pill (click it to open the test, or the square to stop it) and the Load tests icon in the left rail shows a dot. A run keeps going when you close its tab or open another workspace.
Why Start is greyed out
Section titled “Why Start is greyed out”The status line says what to fix. The app checks, in this order:
| Message | Fix |
|---|---|
| Add a request to send | Add at least one request |
| Enable a request with a weight above 0 | Tick a request and give it a weight of 1 or more |
| A request is missing from the collection | A target points at a request that was deleted: remove it |
| A request’s file can’t be read | Fix the request’s YAML (the sidebar shows the error) |
| Only HTTP requests can be load tested | Remove the non-HTTP request |
| A capture needs a variable name and a path | Complete or remove the capture |
| Give a stage a duration | At least one stage needs more than 0 seconds |
| Set a stage target above 0 | At least one stage needs a target above 0 |
| Up to 5,000 users / Up to 50,000 req/s | Lower the stage targets |
| A threshold checks a request this test doesn’t send | Point the threshold at a sent request, or untick it |
The engine checks again when the run starts. It can also refuse with “HTTP/3 isn’t supported for load tests yet” (see below), a capture error such as “capture ‘id’: invalid regular expression”, or a data file problem.
What it measures
Section titled “What it measures”Every finished request becomes one sample. Zorvik keeps an HdrHistogram (microsecond resolution, 3 significant digits, values up to one hour) for the whole test and for each request, plus one-second buckets for the charts. Memory stays flat however long the run is, apart from one chart point per second.
| Metric | Meaning |
|---|---|
| Requests | Completed requests: every request that got an answer or an error. |
| Throughput (req/s) | Completed requests divided by the elapsed time of the run. The live tile shows the last full second. |
| Latency | min, avg, p50, p90, p95, p99, p99.9 and max, in milliseconds (see below). |
| Errors and error rate | Network errors plus responses with HTTP status 400 or higher, as a count and as a percent of completed requests. |
| Status codes | How many responses had each status, most frequent first. |
| Network errors | Failures by kind: timed out, could not connect, host name not found, TLS handshake failed, proxy error, protocol error, connection broke, cut off by the stop, request could not be built. |
| Dropped | Request-rate model only: requests that were not started because maxInFlight requests were already running. Not counted in requests or errors. |
| Connections | New connections opened. Each one pays for DNS, TCP and TLS. |
| Data in / out | Bytes received and sent, as they went over the wire (bodies are not decompressed). |
| Timing phases | Connect, time to first byte, transfer and the server’s own time from Server-Timing (see Results and reports). |
| Capture misses | Captures that found nothing in a response (see Captures). Not errors. |
| Generator CPU | CPU used by Zorvik itself, so you can tell when your computer, not the server, is the limit. |
Latency runs from the moment a request is sent (virtual users) or from its scheduled start (request rate) to the last byte of the response body. It includes every request that got an answer, whatever the status, and also requests that timed out or were cut off by a stop, counted as the time they waited. Leaving those out would hide exactly the slow ones. Requests that could not connect at all count as errors but have no latency.
In the request-rate model, latency counts from the scheduled start, so a request that started late because the generator or the server fell behind is not made to look fast. See Models and stages.
How requests are sent
Section titled “How requests are sent”Before the run starts, Zorvik reads each target request once and resolves it like a send from the workbench: {{variables}}, path parameters, the headers and auth it inherits from its folders and the workspace, and the body. Then the load generator sends it on its own runtime (one worker thread per CPU core), so the app stays responsive.
Some things work differently from sending a request by hand, on purpose:
| Topic | In a load test |
|---|---|
| Pre-request and post-response scripts | Not run (neither the request’s nor its folders’ or the workspace’s). Tests and OpenAPI spec checks don’t run either. |
| Variables | Resolved once. A request that uses dynamic variables ({{$uuid}}, {{$timestamp}} …), data file columns or captured values is rendered again for every request. See Data and captures. |
| OAuth 2.0 | The token is fetched (or taken from the cache) once, when the run starts, and used for every request. It is not refreshed during the run. |
| Connections | Reused by default: HTTP/1.1 keep-alive (one request at a time per connection) and HTTP/2 multiplexing (up to 100 requests per connection, more connections when all are busy). Turn Reuse connections off to open a new connection per request. |
| HTTP version | The test’s HTTP version option, else the app setting. HTTP/1.1 and HTTP/2 only: HTTP/3 is refused. |
| Redirects | Not followed. A 3xx is an answer like any other. |
| Cookies | No cookie jar: Set-Cookie is not sent back. |
| Response bodies | Read to the end and counted, not decoded or kept (except the first 1 MB for captures). |
| Per-request settings | A request’s own timeout, redirect, TLS-verification and HTTP-version settings are not used. The test’s Timeout and HTTP version apply, then the app settings (Settings → Requests, Proxy, Certificates). |
| History | Load test requests are not added to the request history. |
Safety: hosts outside your computer
Section titled “Safety: hosts outside your computer”A load test can take a server down. Before a run sends to any host outside this computer and your private networks, the app asks:
Send load to another host? This sends load to api.example.com. Only load test systems you own or are allowed to test.
Run load test starts it; anything else cancels. The question comes every time you start such a test.
These hosts count as local and never ask:
| Kind | Examples |
|---|---|
| Names | localhost, *.localhost, *.local (mDNS), *.home.arpa, *.internal |
| IPv4 | loopback 127.0.0.0/8, private 10.0.0.0/8, 172.16.0.0/12, 192.168.0.0/16, link-local 169.254.0.0/16, 0.0.0.0 |
| IPv6 | ::1, ::, unique local fc00::/7, link-local fe80::/10, and IPv4-mapped forms of the IPv4 ranges above |
Every other host, including a public IP address or a plain intranet name such as intranet, is outside.
The check covers every host the run can reach:
- Hosts from the data file. When a request’s host comes from a data file column (
https://{{host}}/…), the request is rendered with every row, and every host found is checked. - Hosts from captured values. A captured value can’t be known before the run, so it can’t move the load elsewhere: every rendered request must go to a host that was known when the run started. Anything else fails with “host is not a host this run was started for” (counted as a network error).
The live dashboard
Section titled “The live dashboard”The results side updates about four times a second while the test runs. The title says Starting, Live or Stopping.
Tiles
| Tile | Big number | Small line |
|---|---|---|
| Requests / s | The last full second (live) or the run’s average (finished) | The average (live) or the peak second (finished) |
| p50 latency | Median | Average |
| p95 latency | 95th percentile | p90 |
| p99 latency | 99th percentile | Max |
| Error rate | Percent of requests that failed | “errors of requests” |
| Active users / In flight | Users running now (virtual users) or requests in flight (request rate); the peak for a finished run | The stage’s current target (live), or “peak” |
| Requests | Completed requests | Dropped requests, or else connections opened |
| Data in / out | Bytes received | Bytes sent |
| Generator CPU | Zorvik’s CPU as a share of the whole computer | Number of cores |
When the generator uses more than 85 % of the computer’s CPU, a warning says the laptop may be the bottleneck, not the server. Numbers above that level can understate what the server handles: lower the load, or run zorvik load on a bigger machine.
Panels
- Thresholds: each threshold with its live value. Without data yet it shows “no data yet” and a dashed circle. The verdict is final only at the end (see Thresholds).
- Throughput: completed requests per second, errors per second and, for the request-rate model, the target rate as a dashed line.
- Latency (ms): p50, p95 and p99 of each second.
- Users or In flight: active users against the target (virtual users), or requests in flight (request rate).
- Timing: connect, time to first byte, transfer and server-reported time. See Results and reports.
- Per request: requests, error rate, req/s, p50, p95, p99 and max for each target, plus “1st byte p95” and “Missed” (capture misses) when there is data for them.
- Status codes: the eight most frequent, then “Other”.
- Errors: HTTP errors (status ≥ 400), network errors by kind, dropped requests and capture misses.
The charts start after the first full second. The stage preview in the settings shows a marker at the current second.
Stopping a run
Section titled “Stopping a run”Stop (or Ctrl/⌘ Enter, or the square in the title bar) starts no new requests. Requests in flight get a grace period of up to 5 seconds (less when the request timeout is shorter); whatever is still running then is cut off and counted as a cancelled error with the time it waited. The same grace applies at the planned end of a run. A stopped run is still saved to the history, marked Stopped early, and its thresholds are checked against what was measured.
Quitting Zorvik while a test runs asks first. If you quit anyway, the test is stopped and the app waits up to 7 seconds so its result is saved.
Limits
Section titled “Limits”| Limit | Value |
|---|---|
| Virtual users per stage | 5,000 |
| Requests per second per stage | 50,000 |
Requests in flight (maxInFlight) | 1 to 100,000 (default 1,000) |
| Stage duration (in the app’s editor) | 86,400 s (one day) per stage |
| Think time and timeout (in the app’s editor) | 3,600,000 ms (one hour) |
| Weight (in the app’s editor) | 0 to 1,000 |
| Runs kept in the history | The newest 30 per load test |
| Tracked latency | Up to one hour; longer counts as one hour |
On macOS and Linux the generator raises the open-file limit for the run (every connection is a file descriptor). On Windows it asks for 1 ms timers while the test runs, so scheduled requests start on time.
- Models and stages: virtual users or a request rate, and how the load changes over time.
- Thresholds: pass or fail, and
zorvik loadexit codes. - Data and captures: different data per virtual user, and values carried from one response to the next request.
- Results and reports: history, timing, comparing runs, HTML and JSON reports.